


Understanding the Role of Common Trading Indicators in Technical Analysis
Technical analysis isn’t about guesswork—at least, not entirely. It’s about structure, repetition, and patterns. And at the heart of that structure lie common trading indicators. These mathematical formulas, layered onto price charts, are used to interpret momentum, volatility, volume, and trend direction.
But which ones are actually useful? Which just look good on paper? Let’s unpack the most widely used technical indicators and what you should really know about each.
1. RSI – A Popular Member of Common Trading Indicators for Momentum Shifts
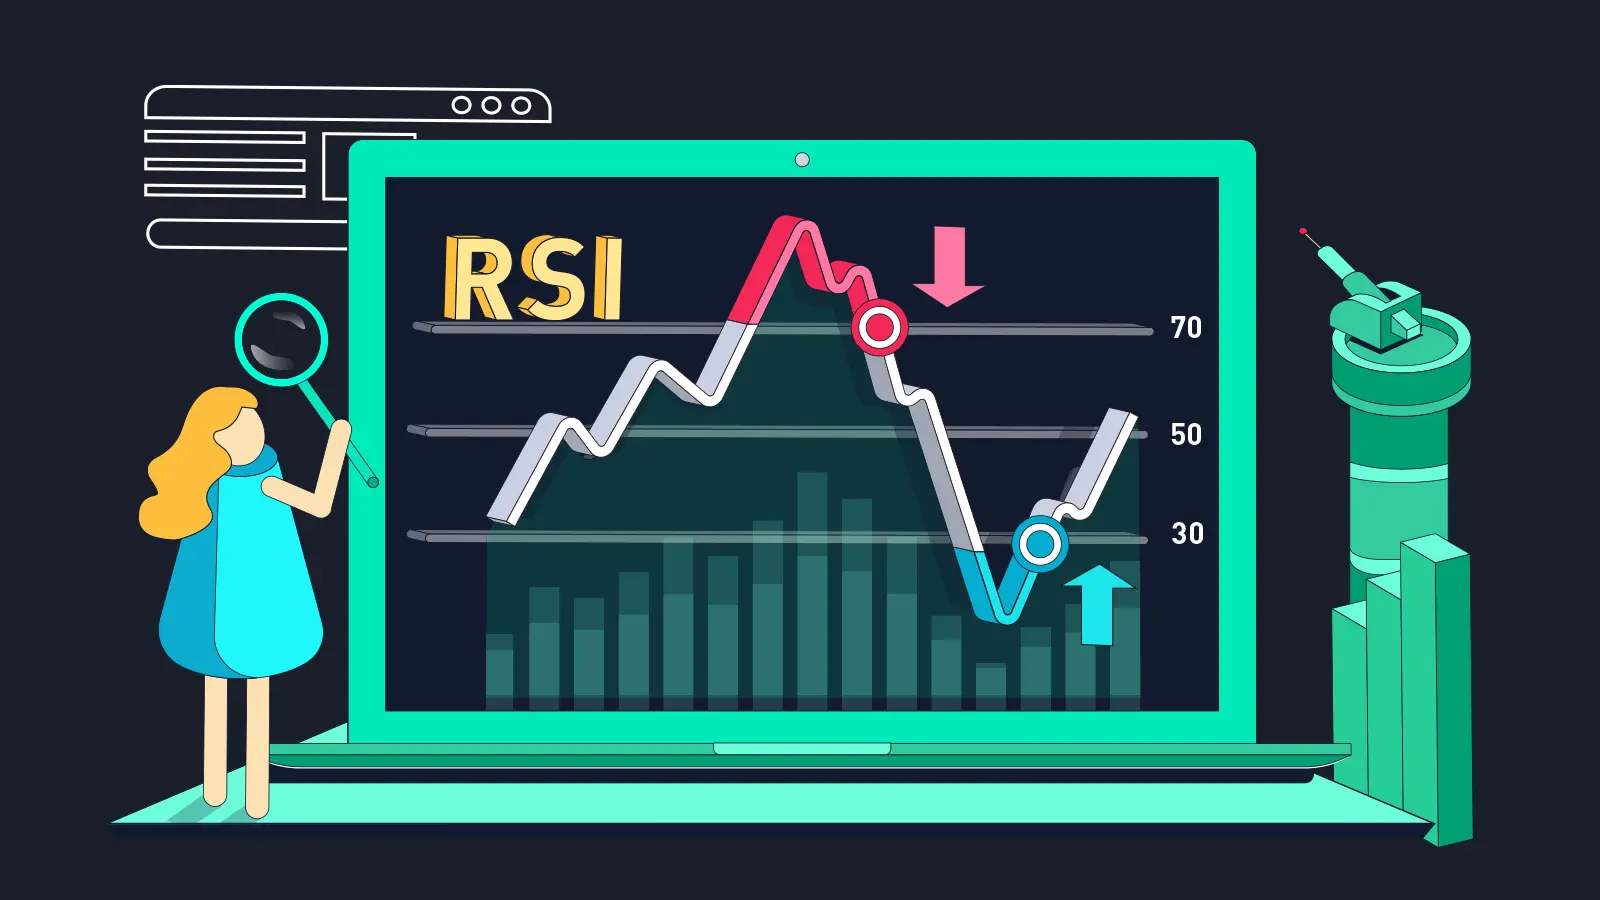
The Relative Strength Index (RSI) measures the magnitude of recent price changes to evaluate overbought or oversold conditions. It oscillates between 0 and 100. Common thresholds are 70 (overbought) and 30 (oversold).
Use Case:
When the RSI crosses below 30 and then back above, it can signal a potential bullish reversal. But beware—trends can remain extended for long periods. RSI works better in sideways markets, not strong trends.
2. Moving Averages – How Common Trading Indicators Reveal Trend Bias
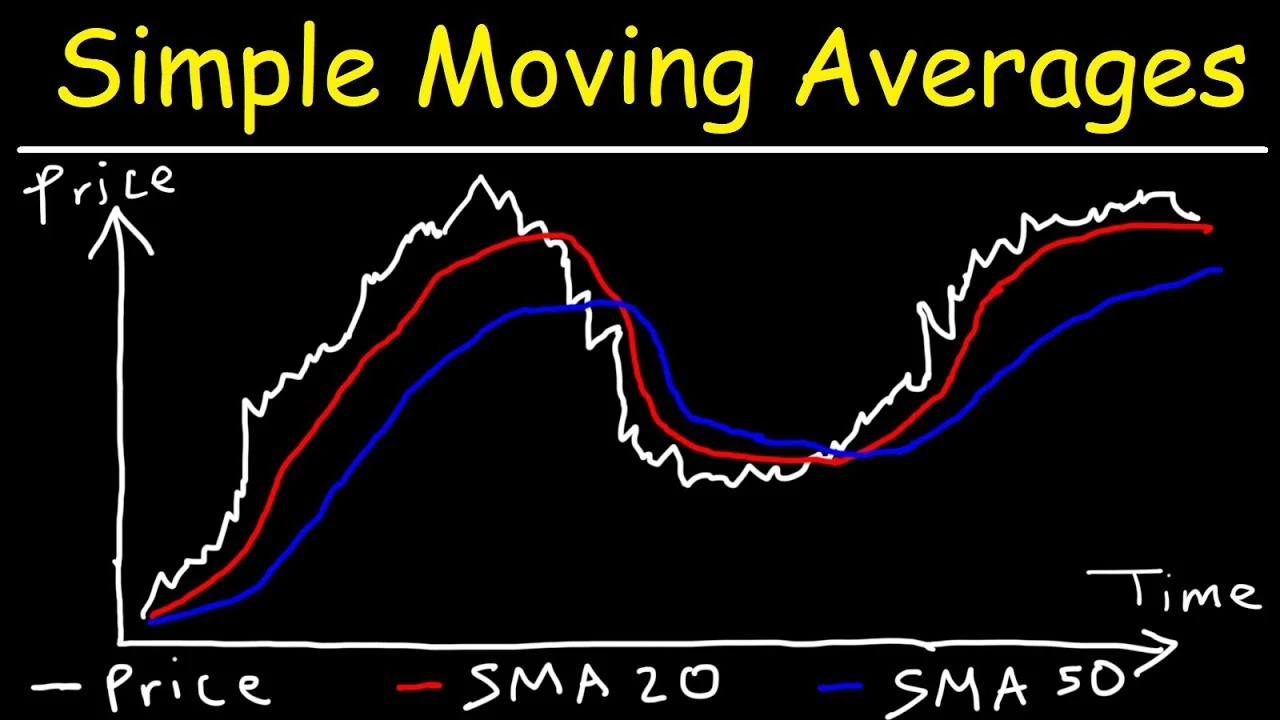
One of the foundational common trading indicators, moving averages reduce market noise by smoothing out price data. The Simple Moving Average (SMA) gives equal weight to all data points, while the Exponential Moving Average (EMA) puts more weight on recent data.
Use Case:
Traders often look for crossover signals—like when the 50 EMA crosses above the 200 EMA (a bullish signal). But remember, these are lagging indicators. They follow price, not lead it.
3. MACD – Combining EMAs for Advanced Signal Detection
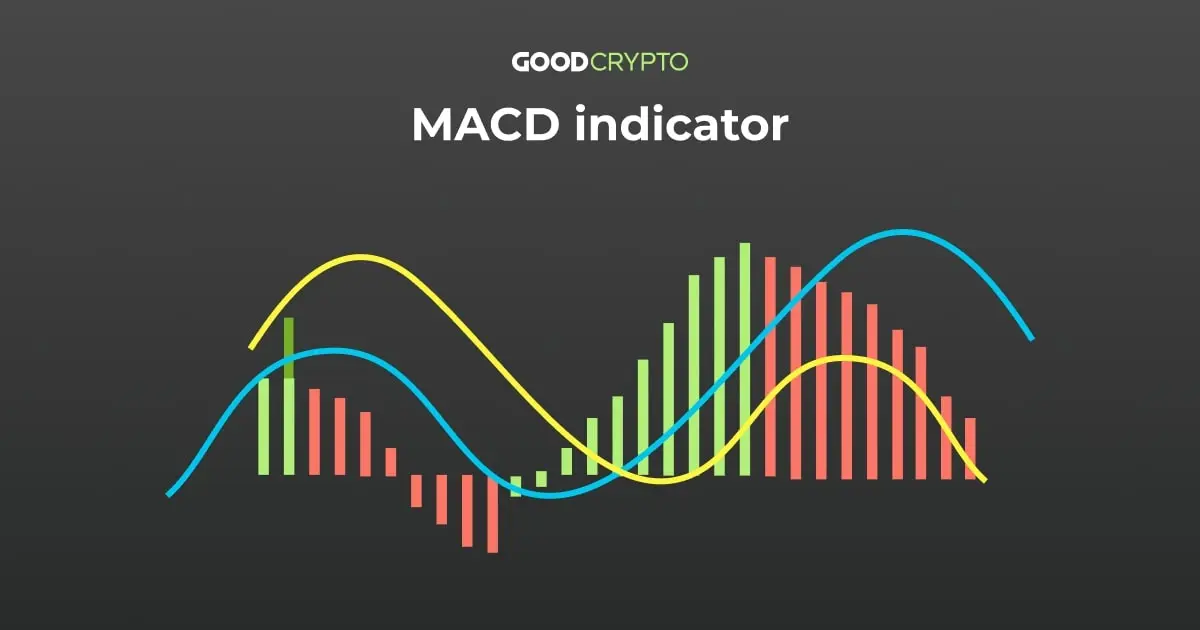
The Moving Average Convergence Divergence (MACD) is built from the relationship between two EMAs. It includes a MACD line, a signal line, and a histogram that shows the difference between the two.
Use Case:
MACD crossovers (MACD line vs. signal line) and histogram shifts are used to identify changes in momentum. Divergences between MACD and price can hint at a trend reversal. Still, false signals are common during choppy markets.
4. Bollinger Bands – Volatility Tools Within Common Trading Indicators
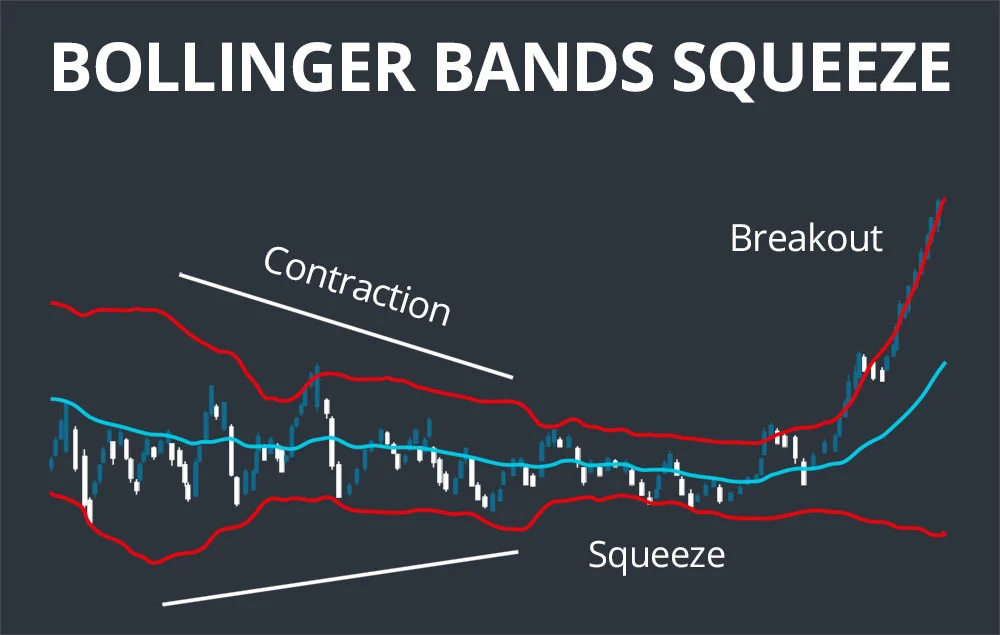
Developed by John Bollinger, these bands consist of a moving average and two standard deviation lines—one above and one below.
Use Case:
Tight bands suggest low volatility and possible upcoming breakouts. A price touch outside the bands may signal overextension, but not always a reversal. Don’t use Bollinger Bands in isolation—they’re descriptive, not predictive.
5. Stochastic Oscillator – Spotting Momentum Turns in Price Ranges

This indicator compares a closing price to a price range over a set period. Like RSI, it’s bounded between 0 and 100, with 80 considered overbought and 20 oversold.
Use Case:
When the %K line crosses above the %D line from below 20, it can suggest a bullish signal. But again, in trending markets, this indicator may generate premature signals.
6. Volume – The Silent Force Behind Common Trading Indicators
Volume is not always considered an “indicator” per se, but it provides crucial context. It tells you how many shares/contracts are being traded in a given period.
Use Case:
Volume spikes often precede major price moves or confirm breakout validity. A breakout on low volume? Treat it with caution. Many traders pair price action with indicators like VWAP or On-Balance Volume (OBV).
7. Fibonacci Retracement – Mathematical Levels of Interest
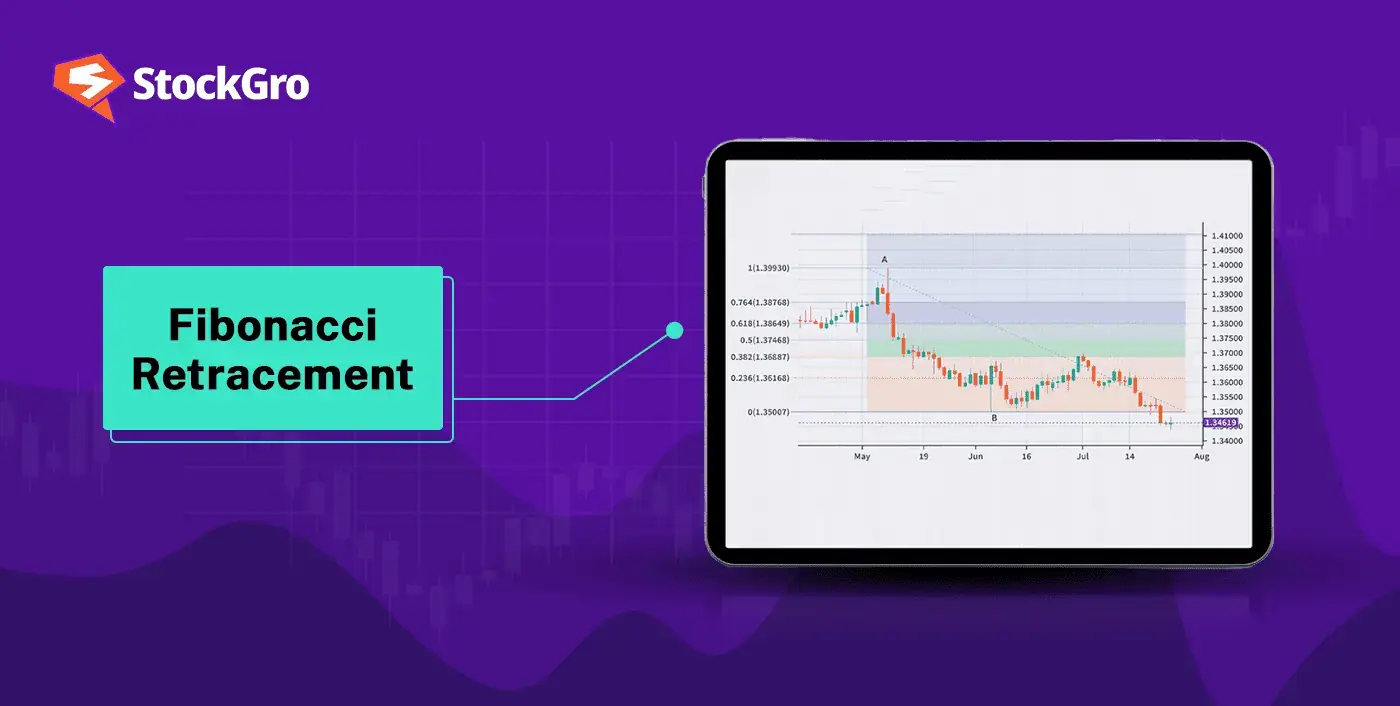
Used to identify potential reversal levels, Fibonacci retracement levels are plotted between two price extremes and highlight key levels such as 38.2%, 50%, and 61.8%.
Use Case:
If price pulls back to the 61.8% level and bounces, it may be seen as a strong continuation signal. These levels often work due to widespread use—self-fulfilling prophecy or not, traders pay attention to them.
Final Word on Common Trading Indicators

No single tool offers absolute accuracy, and that’s key. Common trading indicators serve best when layered together—like pieces of a puzzle. One may highlight momentum, another confirms volume, while a third shows price behavior within bands.
Technical traders must understand the logic behind each indicator—not just the signal. These tools aren’t about certainty, they’re about edge. And even then, edge isn’t everything. Execution, discipline, and context? Those matter more.
In the end, indicators are just that—indicators. They suggest, they hint, they highlight. What they don’t do is guarantee. That’s your job.
Relevent news: Here


